2024-08-4-15 アルゴンヌ国立研究所(ANL)
<関連情報>
- https://www.anl.gov/article/a-visionary-approach-how-an-argonne-team-developed-accessible-maps-for-colorblind-scientists
- https://journals.ametsoc.org/view/journals/bams/105/8/BAMS-D-23-0056.1.xml
色覚障害のあるユーザーに対するレーダーデータの効果的な可視化 Effective Visualization of Radar Data for Users Impacted by Color Vision Deficiency
Zachary Sherman,Max Grover,Robert Jackson,Scott Collis,Joseph O’Brien,Cameron R. Homeyer,Randy J. Chase,Timothy J. Lang,Daniel M. Stechman,Alyssa Sockol,Kai Muehlbauer,Jonathan Thielen,Adam Theisen,Sam Gardner, and Daniel Michelson
American Meteorological Society Published:12 Aug 2024
DOI:https://doi.org/10.1175/BAMS-D-23-0056.1

Abstract
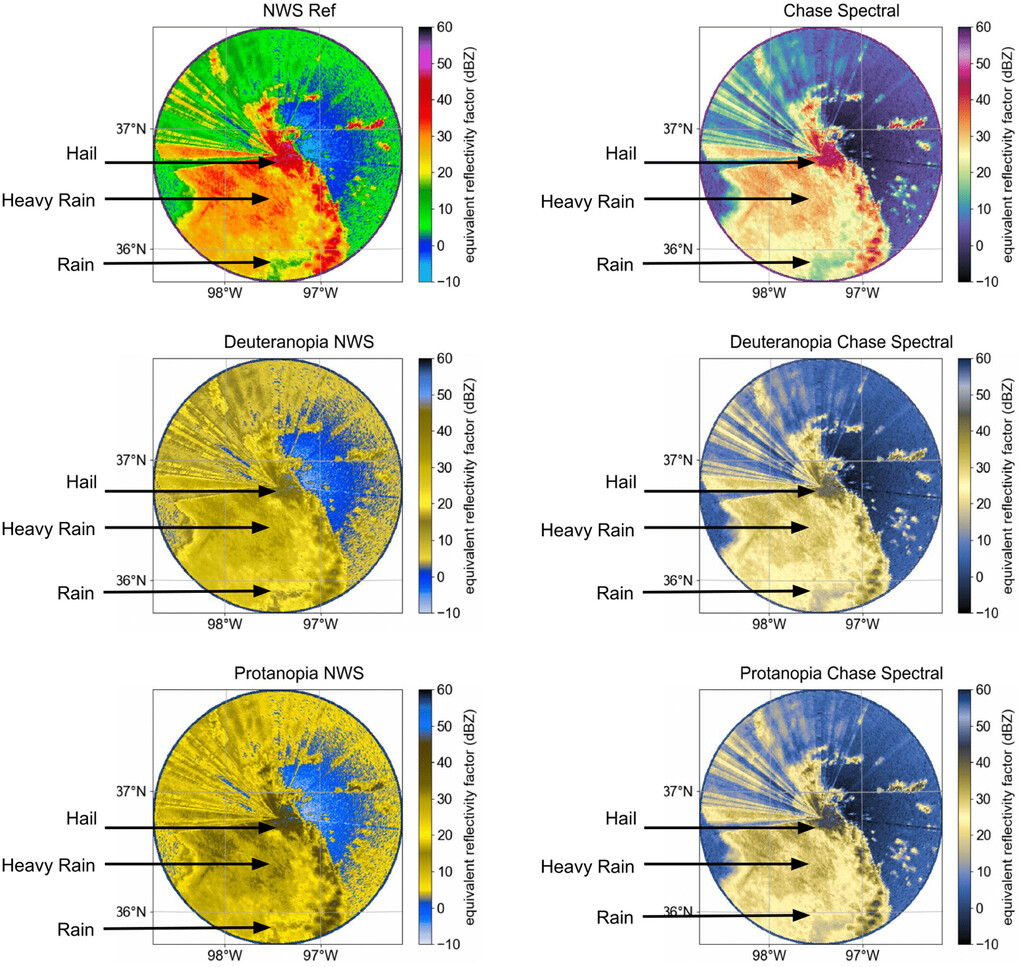
Color vision deficiency (CVD) is a decreased ability to discern between particular colors. Eight percent of genetic males and half a percent of genetic females have some form of CVD, with many in the radar community falling into this group. When presenting data on a two-dimensional plane, it is common to use colors to represent values via a colormap. Colormap choice in the radar community is influenced by the ability to highlight scientifically interesting features in data, institutional choices, and domain dominance of legacy colormaps. The problem with these current colormaps is that many do not project well for those with CVD (i.e., green next to red). In working with the CVD community to address this problem, multiple colormaps for moments such as equivalent reflectivity factor and Doppler velocity were created for users with forms of CVD such as deuteranomaly, protanomaly, protanopia, and deuteranopia using Python tools such as colorspacious and viscm. We show how these colormaps can improve interpretability for four cases: a mesoscale convective system, a pyrocumulonimbus storm, a wintertime midlatitude cyclone, and widespread storms with a large bird migration. These new radar equivalent reflectivity factor, Doppler velocity, and polarization colormaps are designed to highlight rain, frozen precipitation, nonmeteorological targets, and velocity-based items, are perceptually uniform, and are visually friendly for those with CVD.


