- コロナウイルスの研究を促進し、将来のパンデミックに備えるための国立合成データセット National synthetic dataset boosts coronavirus research, helps prepare for future pandemics
コロナウイルスの研究を促進し、将来のパンデミックに備えるための国立合成データセット National synthetic dataset boosts coronavirus research, helps prepare for future pandemics
2022-04-27 ワシントン大学セントルイス
米国国立衛生研究所(NIH)の全米トランスレーショナル・サイエンス推進センターが資金提供し、セントルイスのワシントン大学医学部が共同で主導したイニシアチブでは、ビッグデータと高度な計算ツールを活用し、患者のプライバシーと機密の保護を確保しつつ、COVID-19の理解に不可欠な実際の患者データをモデルにした大量の合成データを研究者に提供することに成功しました。
<関連情報>
- https://source.wustl.edu/2022/04/synthetic-data-mimics-real-patient-data-accurately-models-covid-19-pandemic/
- https://academic.oup.com/jamia/advance-article/doi/10.1093/jamia/ocac045/6561547?login=false
地理的・時間的な合成疫学データの有用性を評価するアプローチを実証。米国における180万件以上のSARS-CoV-2検査の解析結果 National COVID Cohort Collaborative (N3C) Demonstrating an approach for evaluating synthetic geospatial and temporal epidemiologic data utility: Results from analyzing >1.8 million SARS-CoV-2 tests in the United States National COVID Cohort Collaborative (N3C)
Jason A Thomas, Randi E Foraker, Noa Zamstein, Jon D Morrow, Philip R O Payne, Adam B Wilcox, the N3C Consortium
Journal of the American Medical Informatics Association Published:31 March 2022
DOI:https://doi.org/10.1093/jamia/ocac045

Abstract
Objective
To evaluate whether synthetic data derived from a national COVID-19 data set could be used for geospatial and temporal epidemic analyses.
Materials and Methods
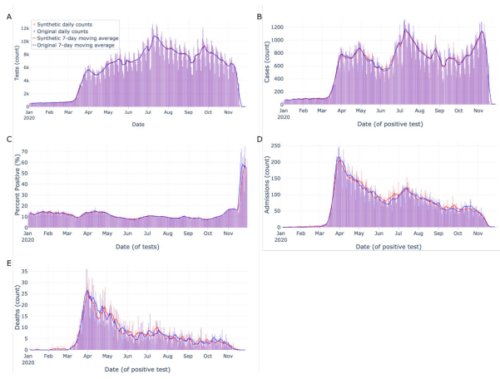
Using an original data set (n = 1,854,968 SARS-CoV-2 tests) and its synthetic derivative, we compared key indicators of COVID-19 community spread through analysis of aggregate and zip-code level epidemic curves, patient characteristics and outcomes, distribution of tests by zip code, and indicator counts stratified by month and zip code. Similarity between the data was statistically and qualitatively evaluated.
Results
In general, synthetic data closely matched original data for epidemic curves, patient characteristics, and outcomes. Synthetic data suppressed labels of zip codes with few total tests (mean=2.9±2.4; max=16 tests; 66% reduction of unique zip codes). Epidemic curves and monthly indicator counts were similar between synthetic and original data in a random sample of the most tested (top 1%; n = 171) and for all unsuppressed zip codes (n = 5,819), respectively. In small sample sizes, synthetic data utility was notably decreased.
Discussion
Analyses on the population-level and of densely-tested zip codes (which contained most of the data) were similar between original and synthetically-derived data sets. Analyses of sparsely-tested populations were less similar and had more data suppression.
Conclusion
In general, synthetic data were successfully used to analyze geospatial and temporal trends. Analyses using small sample sizes or populations were limited, in part due to purposeful data label suppression – an attribute disclosure countermeasure. Users should consider data fitness for use in these cases.


